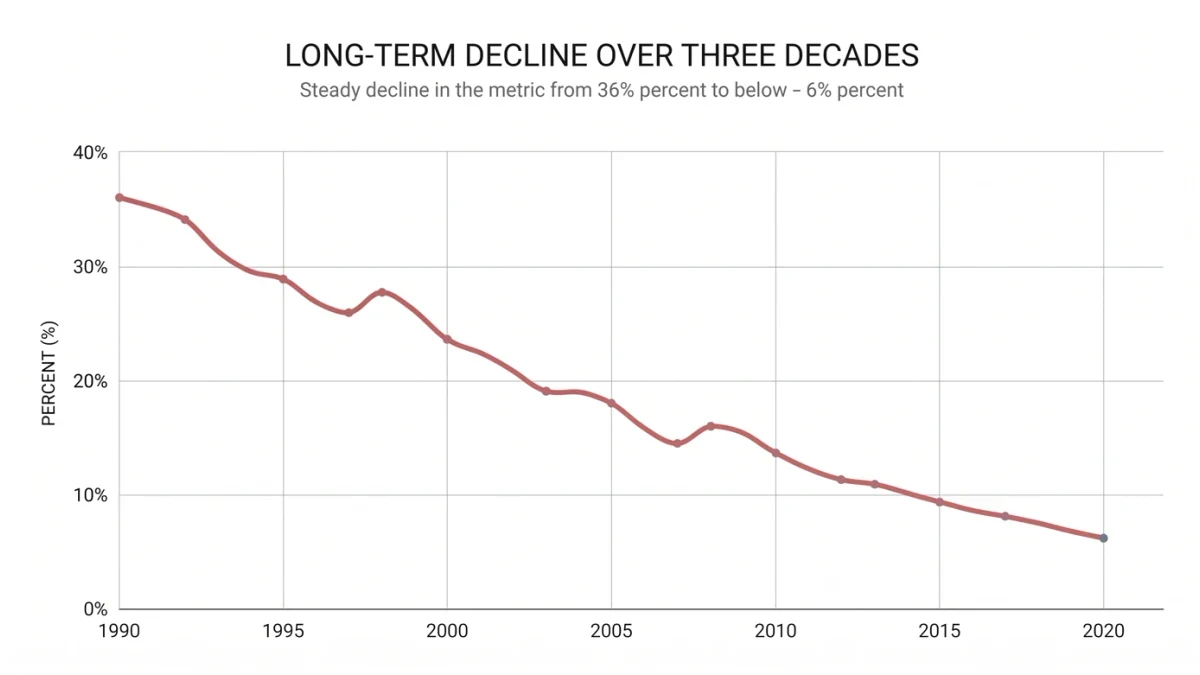
The central technical fact of modern polling is that almost nobody answers. Telephone response rates — the share of sampled households that complete an interview — have fallen from roughly one-third in the 1990s to the low single digits, per the Pew Research Center's methodological reports, which documented its own telephone response rate falling from 36 percent in 1997 to 6 percent by 2018 and lower in subsequent cycles. A modern national poll is therefore a small sample of unusual people — disproportionately civically engaged, available, and willing to talk to strangers — statistically reshaped to resemble the country. The 2020 and 2024 cycles, in which national polls performed reasonably by historical error standards while several state polls missed again, did not resolve the profession's methodological debate; they sharpened it.
What went wrong in the miss years?
Two failure modes recur in the post-election assessments, most authoritatively the American Association for Public Opinion Research's ad hoc committee reports on 2016 and 2020. The first is nonresponse bias linked to political engagement: voters less engaged with politics — who in recent cycles skewed toward one party — were less likely to take surveys even among registered voters, so samples overstated the engaged. The second is weighting-variable choice: pollsters who weighted on education corrected part of the 2016 error; in 2020 the residual miss concentrated among low-trust, high-social-engagement voters whom telephone and online panels alike underrepresented, and ballot measure validation suggested genuine late deciders broke unevenly. The 2024 post-election AAPOR evaluation found national polls unusually accurate while some state and exit polling problems persisted — an asymmetric record that argues the errors are poll-type-specific, not uniform decline.
How does weighting actually work — and fail?
Weighting multiplies each respondent by the inverse of their sampled probability adjusted to match population benchmarks: census demographics, party registration or vote recall in past elections, sometimes education and urbanicity. The method assumes that within each weighting cell, respondents and nonrespondents resemble each other — the assumption violations of which the miss years were made. When the people who answer differ from the people who dodge within the same demographic cell, no amount of demographic rebalancing repairs it; pollsters respond by adding political variables to the weights, which imports its own assumption: that past vote recall is accurate and stable. One firm's decision to weight to party identification while another weights to vote recall can move a result by several points using identical raw data — a transparency problem, because published toplines do not disclose which choices were made.
What are the newer designs?
Three families have gained share. Probability panels — large recruited panels with known sampling probabilities, like AmeriSpeak or KnowledgePanel — retain statistical defensibility at high cost and still face attrition bias. Nonprobability online samples with deep weighting and sample matching — the majority of commercial election work — are fast and cheap and lean hardest on modeling assumptions. Registration-based sampling, mailing invitations to sampled voter-file records with online completion, links the sample to actual turnout history, which helped several state pollsters who performed better in recent cycles. Text-message and app-based recruitment rounds out the field. The pattern in the methodological literature is that design explains less of the variance than the adjustment choices stacked on top of the design.
What is poll aggregation doing to public understanding?
Blunting the noise and blurring the differences. Aggregators average polls weighted by recency, house effects and sample quality, which genuinely reduces random error — but averaging also mixes incompatible weighting assumptions into one number, so a model's output is only as transparent as the least transparent input. When aggregated margins tighten late in a race, the movement is often house-effect rebalancing, not voters changing minds. Journalists who report a 2-point lead from a single poll with a 3-point margin of error are not reporting a finding; they are reporting a coin flip with branding.
How should a news consumer read polls now?
With four habits. Prefer firms with published methodology and track records over anonymous numbers. Read the margin of error as applying to each candidate's share, doubling the intuitive width for a lead. Treat a divergence between national and state polls as information about the polls, not the race. And watch for weighting disclosures — party versus recall versus demographics — which explain more inter-poll variance than sample size ever will. The polling profession has not become unable to measure public opinion; it has become dependent on assumptions it cannot verify, and the honest outlets say so in the methodology box rather than the disclaimer.